
The release of granular bank-level data by a European financial watchdog offers a glimpse into lenders’ exposure to climate transition risks

Once a year, the inner workings of the European Union’s major banks are laid bare for all to see. Following annual ‘transparency exercises’, the European Banking Authority (EBA) publishes rich datasets detailing the nitty-gritty of banks’ loan books, along with information on each lender’s capital levels, profitability, and leverage.
These datasets can be plundered for rough insights into the EU banking sector’s climate transition-sensitive exposures, an exercise Climate Risk Review ran last yearusing the ‘climate policy relevant sectors’ (CPRS) taxonomy developed by European academics (Battiston et al, 2017).
This year’s transparency exercise covered 120 banks across 25 countries, with information as of September 30 and December 31 2020, as well as March 31 and June 30 2021. Although the sample size is slightly different for each date, thanks to the variable reporting practices of the banks included, the data makes it possible to track lending trends by economic sector over time, both in the aggregate and at the individual bank level.
This is because the transparency exercise maps the bank-level loan data to the European industry classification taxonomy — NACE. Loans and advances in the transparency exercise data are identified by their ‘Level 1’ NACE codes, each of which refers to one of 21 economic sectors. These sectors are broad by nature, and each hosts multiple sub-industries. Still, it is possible to rank each Level 1 sector by their sensitivity to climate transition risk using methodologies promoted by the EBA and other European authorities.
One such methodology uses the CPRS taxonomy mentioned above. This identifies economic activities that could be impacted by a disorderly low-carbon transition by evaluating their direct and indirect contribution to GHG emissions, their relevance for climate policy implementation, and their place in the energy value chain.
The taxonomy classifies loans to entities engaged in the following NACE Level 1 sectors to be 100% ‘climate relevant’: agriculture, electricity, steam and gas, and real estate. Loans to organizations involved in water supply, mining and quarrying, transport and storage, construction, and manufacturing are also predominantly CPRS exposures under the taxonomy.
The EBA used the CPRS methodology as one lens through which to assess banks’ climate risks in its recent climate pilot exercise. This used loan data submitted by 29 volunteer banks as of December 2019, which was sorted by CPRS categories as shown below:
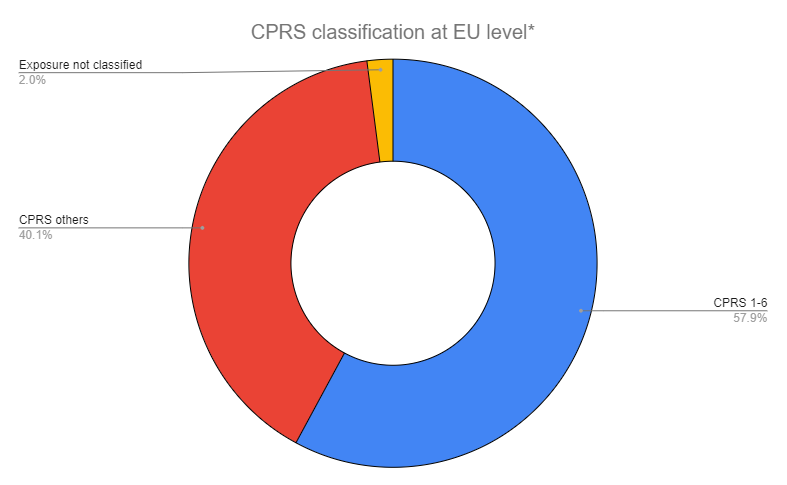
*Battiston et al reclassify the NACE Level 1 sectors into eight CPRS categories. These are (1) Fossil fuel (2) Utility (3) Energy-intensive (4) Buildings (5) Transportation (6) Agriculture (7) Finance (8) Others. Exposures to CPRS 1 to 6 (CPRS 1-6) are defined as those exposures that may be potentially affected by climate transition risks.
For the EBA’s climate pilot exercise, 98% of participating EU banks’ €2.34 trillion of exposures were classified using the CPRS.

Source: Mapping climate risk: Main findings from the EU-wide pilot exercise
This data simply reiterates the transition sensitivity of exposures to the NACE Level 1 sectors mentioned above.
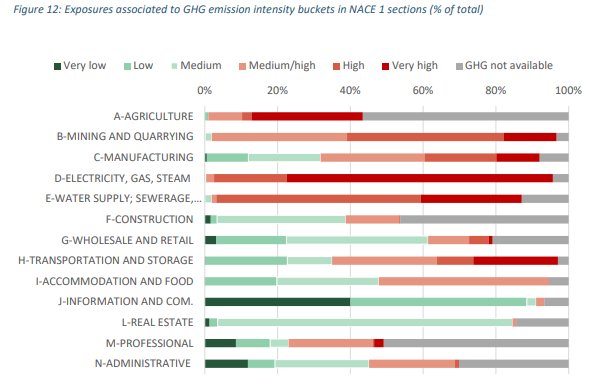
The EBA also used a GHG emissions approach in its pilot exercise, which graded sectors’ transition risk based on their carbon intensities. This approach identified exposures to electricity, steam and gas, and manufacturing as being the most GHG-intensive, with 45% and 25% of all exposures to borrowers in these sectors having ‘very high’ emissions intensities, respectively. Mining and quarrying, water supply, transportation and storage, and agriculture exposures were also found to include heavy concentrations of emissions-intensives borrowers.
With both the CPRS and GHG emissions approaches, the ‘mapping’ to NACE Level 1 sectors has its shortcomings. This is because it obscures the heterogeneity of exposures within each sector. For example, the EBA’s pilot exercise found that for fully half of the banks assessed, the share of CPRS 1-6 exposures within certain NACE Level 1 sector exposures (manufacturing, construction, transportation, water supply, and mining and quarrying) was over 70%. This means that for the other half, the prevalence of CPRS exposures was lower, and in some cases may have been much, much lower.
As for the GHG emissions approach, the dispersion of emissions intensities was found to vary wildly within NACE Level 1 sectors. The EBA singled out the manufacturing and transport sectors as exhibiting particularly high dispersion, meaning some obligors in these sectors are ‘carbon hogs’ while others are relatively ‘green’.
Source: Mapping climate risk: Main findings from the EU-wide pilot exercise
Still, unless and until the EBA publishes exposure data at a higher level of granularity, the NACE Level 1 sector breakdown will have to do.
For the purposes of the below analysis, which uses the EBA transparency exercise data, those NACE Level 1 sectors highlighted above as particularly transition-sensitive will be termed ‘high transition risk sectors’ (HTRS). The HTRS are: agriculture; construction; electricity, steam and gas; manufacturing; mining and quarrying; real estate; transport and storage, and water supply.
Europe’s most transition-sensitive banks 2021
At the EU/EEA-wide level, the gross carrying amount of loans and advances to the eight HTRS made up 62.6% of the total as of June 2021. Exposures to real estate activities accounted for the largest portion, with 25.4% of total loans, followed by manufacturing with 15.3%. Exposures to the water supply sector made up the smallest portion — just 0.9% of total loans.
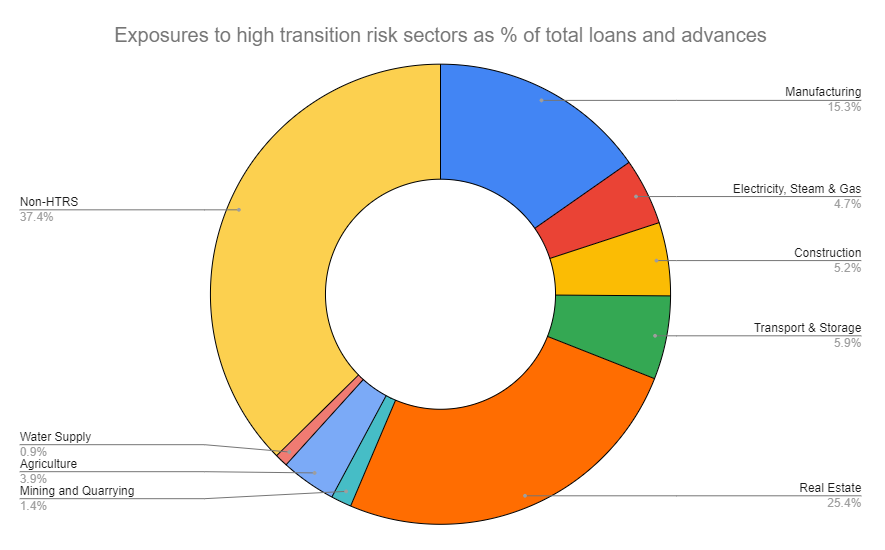
Source: EU-wide transparency exercise, data as of June 2021. Gross carrying amounts.
The vast majority of these HTRS loans were concentrated in a small number of major banks. True, it is to be expected that the larger the bank, the more HTRS loans they would hold, but the concentration is nonetheless very high. In fact, the five largest banks by total loans — BNP Paribas, Crédit Agricole, Santander, Groupe BPCE, and Crédit Mutuel — accounted for 29.3% of total loans, and 26.7% of all HTRS loans. That’s 6% of banks in the sample accounting for over a quarter of all transition-sensitive loans.
For some HTRS, the concentration was even greater. The five largest banks held 38.1% of all exposures to mining and quarrying and 32.8% of all exposures to agriculture.
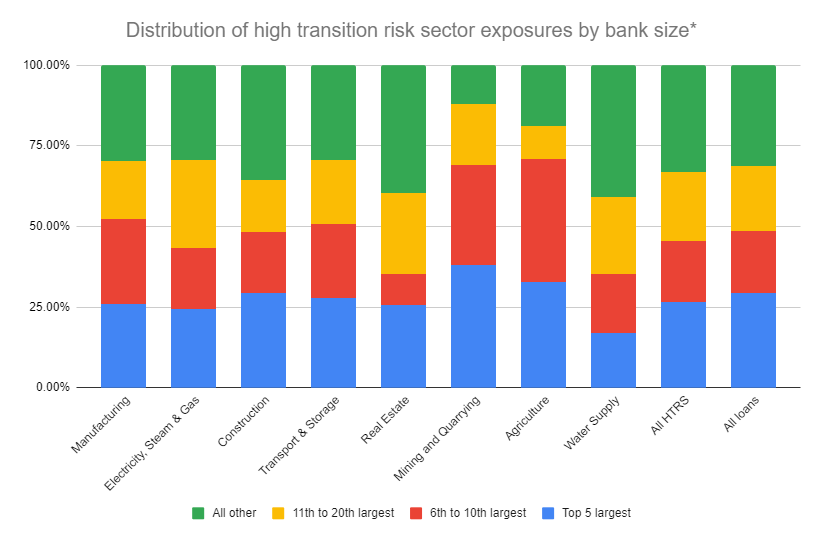
*The 20 largest banks by loans and advances, in ascending order, are: DZ Bank, SEB, Commerzbank, Bayerische Landesbank, Danske Bank, Handelsbanken, Nordea, CaixaBank, BBVA, Deutsche Bank, Rabobank, Societe Generale, ING, Intesa Sanpaolo, UniCredit, Crédit Mutuel, Groupe BPCE, Santander, Crédit Agricole, BNP Paribas
Source: EU-wide transparency exercise, data as of June 2021. Gross carrying amounts.
Big HTRS loan balances do not necessarily imply a bank is especially transition-sensitive, especially if it is a bulge bracket lender. BNP Paribas, for instance, had the most HTRS loans of any bank in the sample, with €244.8 billion. These represented 58% of its total loan book. Still, there were 67 other banks in the sample that had a higher percentage of HTRS loans to total loans. Eight banks had over 90% of their total loans outstanding to HTRS obligors: SBAB Bank, Kuntarahoitus Oyj, Deutsche Pfandbriefbank, Aareal Bank, BNG Bank, Kommuninvest, Landesbank Berlin, and Nykredit. Most of these banks are on the smaller side relative to the sample as a whole. Just one of them — Nykredit — is in the topmost quartile of banks by total loans. Furthermore, at each of these banks, real estate exposures made up by far the largest share of their HTRS portfolios — 86.4% on average.
The five banks with the most HTRS exposures by HTRS sector are shown in the tables below (and can also be viewed here).

Source: EU-wide transparency exercise, data as of June 2021. Gross carrying amounts.
This data reveals the dispersion of HTRS loan concentrations by sector. Of particular note is the high concentration of electricity, steam and gas exposures among German lenders. The small size of mining and quarrying and water supply portfolios is also striking.
Are EU banks tilting away from high transition risk sectors?
Banks have ramped up their climate action this year, most significantly through the founding of the Net-Zero Banking Alliance (NZBA) by the UN’s Special Envoy for Climate Action and Finance, Mark Carney. Of the banks in the EBA transparency exercise sample, 27 are members of the NZBA. On average, these banks had 62.3% of their loan books allocated to HTRS as of June 30, 2021. Svenska Handelsbanken had the highest share, with 86.1%, the majority of which were real estate exposures.
Have these banks’ exposures to HTRS changed since the inception of the NZBA? An exact like-for-like comparison in the aggregate is not possible because the September 30 2020 dataset does not include Rabobank. Excluding Rabobank, the average HTRS holdings of NZBA banks stood at 62.05% at June 30 and 62.7% at September 30. Aggregate nominal HTRS loans across the NZBA banks excluding Rabobank amounted to €2.31 trillion in June, down from €2.33 trillion in September.
This difference may in part reflect the standard oscillation of bank loan books over time, but it’s also possible that some NZBA banks which set net-zero emissions portfolio targets shed certain carbon-intensive exposures over this nine month period. The September-to-June change in mining and quarrying exposures, from €80.8 billion to €72.6 billion — a 10% drop — could support this interpretation. However, it’s also true that non-NZBA banks cut their mining and quarrying exposures significantly over this time frame, too.
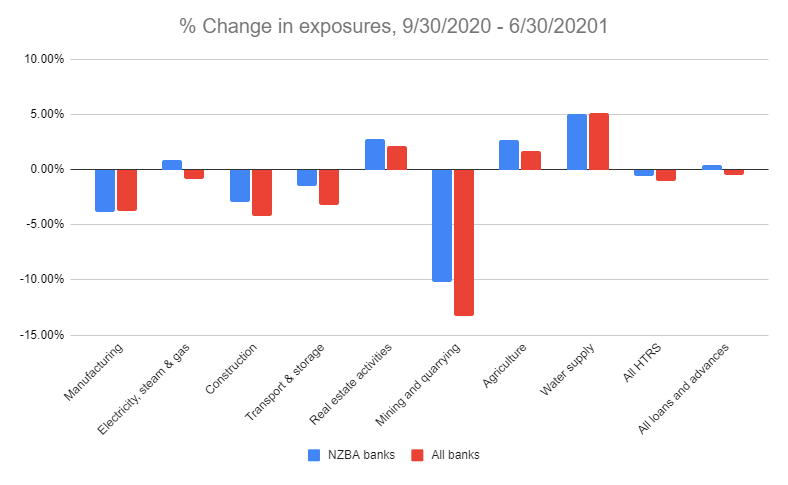
Source: EU-wide transparency exercise
Indeed, the fact that NZBA banks’ portfolio changes largely mirror those seen across the sample as a whole suggests that the Alliance has not — yet — influenced lending behavior among its membership relative to non-NZBA banks. Of course, this is only true at the Level 1 NACE sector level. Within HRTS portfolios, NZBA banks very well may be taking actions to discard loans from ‘carbon hog’ obligors in favor of their ‘greener’ peers, and/or engaging with obligors to put them on a net-zero pathway.
Conclusion
In spite of the richness of the data provided by the EBA, from a climate risk perspective the transparency exercise produces more questions than answers.
For example, are those banks with very high exposure to real estate, but low exposure to other HTRS, truly among the most transition-sensitive? Yes, real estate lending is subject to transition risk as many properties are energy-intensive and could become more costly to build, own, and manage if carbon pricing and/or energy-efficiency measures start to bite. But in some jurisdictions, many properties are already — or are in the process of — becoming more ‘green’, reducing this risk. Some banks are also tilting their portfolios towards ‘green’ mortgages, meaning their real estate portfolios may not qualify as HTRS exposures at all.
Also, what would the financial impact of an actual climate transition shock be on those banks holding large HTRS portfolios? Under the disorderly transition scenario used in its pilot exercise, the EBA projected that additional expected losses as a share of risk-weighted assets would be highest for real estate, electricity, steam and gas, and manufacturing exposures relative to the baseline. Firm-level probabilities of default (PDs) were estimated to increase the most for mining and quarrying, electricity, steam and gas, and water supply exposures.
Sectoral changes (pp) in firm-level PDs with respect to the orderly transition scenario (2020 to 2050)
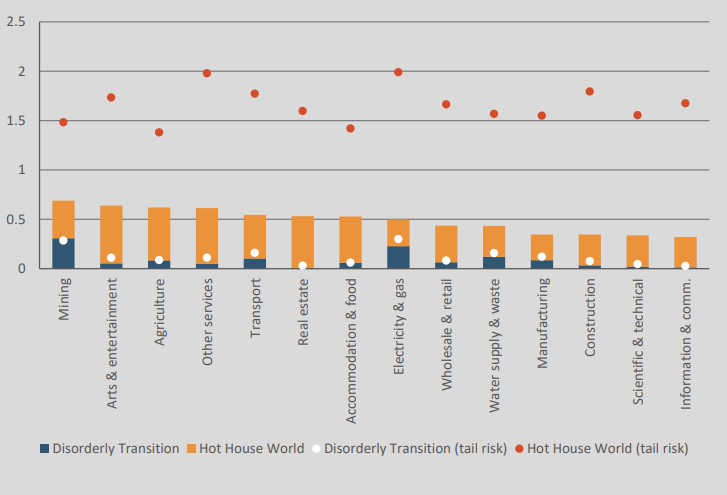
Source: Mapping climate risk: Main findings from the EU-wide pilot exercise
This suggests those banks with concentrated exposures to these HTRS are most at risk. Still, the question remains whether the projected increases in losses and PDs over a 30-year time horizon truly pose a looming threat to any bank’s solvency.
Further climate scenario exercises and stress tests, using far more granular loan-level data, are needed to properly get to grips with the solvency implications of HTRS-laden portfolios. Europe’s financial authorities are on the case. Next year’s supervisory climate stress test by the European Central Bank in particular should yield richer insights into the transition risks faced by the region’s largest lenders.